How much can you earn with Airbnb in Mira Mesa (San Diego) in 2024 - Market Analysis
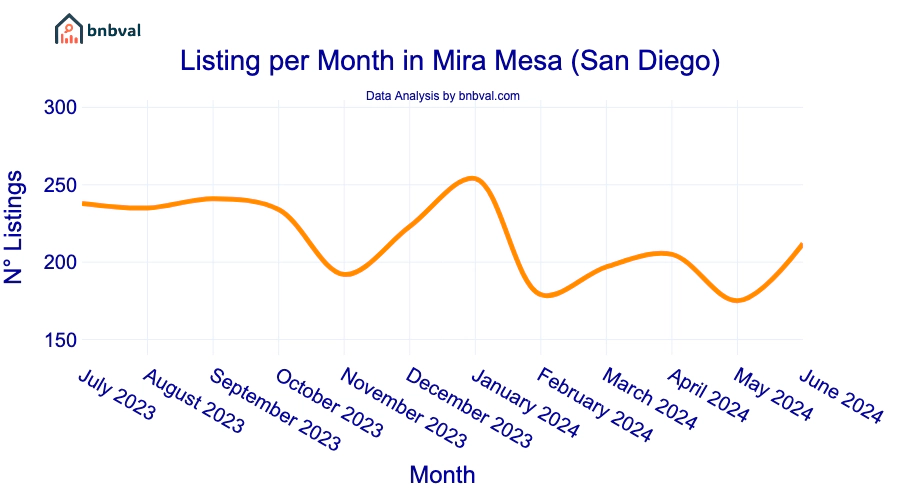
In June, there were 212 active listings, marking a 21.1% increase from the previous month.

How much can you earn with Airbnb in Mira Mesa (San Diego) in 2024 - Average Nightly Prices
The average price per night in Mira Mesa (San Diego) over the past 12 months was 127$.
This value is influenced by various factors, including the property’s location, size, features, and services offered. Moreover, prices can vary significantly based on season and local events.
- In June, the average price for a whole house type was 222$.
- In June, the average price for a room type was 58$.

How much can you earn with Airbnb in Mira Mesa (San Diego) in 2024 - Occupancy Rate
The occupancy rate plays a crucial role in determining earnings from Airbnb.
In Mira Mesa (San Diego), the average occupancy rate is 63.2%.
This means that for most of the year, properties on Airbnb have a good chance of being booked.
How much can you earn with Airbnb in Mira Mesa (San Diego) in 2024 - Average Monthly Revenue
The average monthly revenue for an Airbnb property in Mira Mesa (San Diego) is estimated at 2407$.
By analyzing the average price per night and the occupancy rate, the overview clearly indicates the potential monthly earnings and investment opportunities.
Tip