How much can you earn with Airbnb in Cambria Heights, Queens in 2024 - Market Analysis
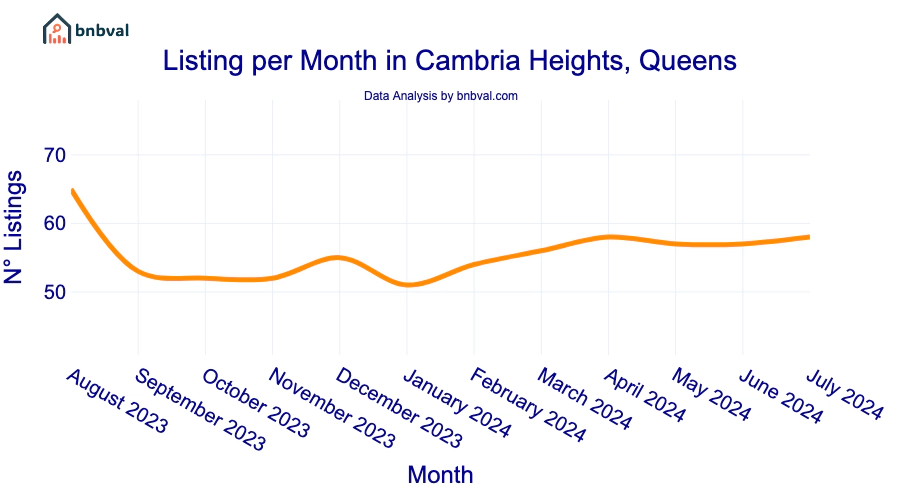
In July, there were 58 active listings, marking a 1.8% increase from the previous month.

How much can you earn with Airbnb in Cambria Heights, Queens in 2024 - Average Nightly Prices
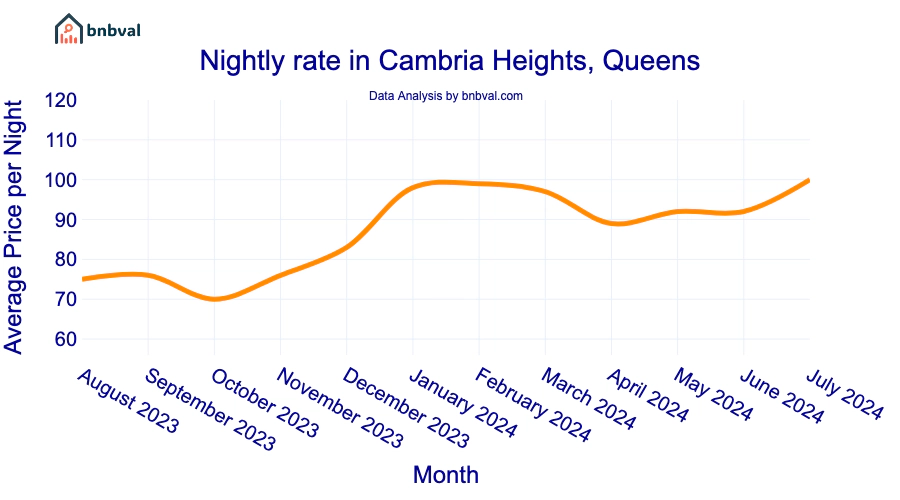
The average price per night in Cambria Heights, Queens over the past 12 months was 106$.
This value is influenced by various factors, including the property’s location, size, features, and services offered. Moreover, prices can vary significantly based on season and local events.
- In July, the average price for a whole house type was 128$.
- In July, the average price for a room type was 100$.

How much can you earn with Airbnb in Cambria Heights, Queens in 2024 - Occupancy Rate
The occupancy rate plays a crucial role in determining earnings from Airbnb.
In Cambria Heights, Queens, the average occupancy rate is 42.1%.
How much can you earn with Airbnb in Cambria Heights, Queens in 2024 - Average Monthly Revenue
The average monthly revenue for an Airbnb property in Cambria Heights, Queens is estimated at 1338$.
By analyzing the average price per night and the occupancy rate, the overview clearly indicates the potential monthly earnings and investment opportunities.
Tip